Data-driven methods have arrived and promise to speed up product development and production planning. Possible benefits for engineers include:
- Reduced analysis time for simulation or test results
- Reduced number of tests or simulation
- Better quality control for test and simulation processes
- Prediction of product behavior without tests or simulation
- Automated enrichment of PLM data
- Automation of geometric modeling tasks
- Optimized parametrization of production systems
So, what do you have to do to leverage this opportunity? One of the challenges is that this list is not only incomplete, but quite generic. It can make a significant difference if you are building an AI-based assistance for the analysis of NVH tests or for the analysis of driving dynamic tests, for example. Both assistance systems will follow a common pattern, but the specifics will be individual. In one case you might be looking at time series data with 500 channels while in the other each datapoint might contain around 50 frequency response curves. Another challenge is that the uncertainty regarding the performance of machine learning based model is comparatively high. Here, the most important factor is typically the quality and quantity of the available data. Finally, data-driven tools for engineers are the result of a collaboration between different stakeholders from engineering, data science and IT.
Canvas-based templates
Building a business model is quite similar in these regards: Business models also revolve along common patterns but are very individual. Furthermore, mapping out a business model is highly collaborative and highly iterative due to the uncertainty and the amounts of stakeholders that are involved in the process. To support business model creation, many tools have been developed. No tool is as popular in the startup world as the Business Model Canvas (BMC) by Alexander Osterwalder and its numerous siblings and cousins. Being very visual, lightweight, and collaborative, canvas-based tools can be used for both quick brainstorming sessions, but also for deep dives on specific topics.
Thus, it is not surprising that this method is already used in the machine learning community. The Machine Learning Canvas by Louis Dorard focusses on the development and the lifecycle of the ML model. In contrast, the AI Project Canvas by Jan Zawadzki closely follows the original BMC and is geared towards the business value of the ML-based solution. In this blog, we present a novel holistic view on building ML-based tools that connects a big picture (i.e. executive) view with concrete implementation-level concepts. Our AI-assisted Engineering Canvas is targeted towards innovative engineers and includes several key insights of the Renumics team that encapsulate years of experience in data-driven engineering. The core goals of the AI-assisted Engineering Canvas are the following:
- Enable engineers to get a holistic view on a possible machine learning based solution for their workflow.
- Enable engineers to focus on the business value created by the solution and to communicate effectively with other stakeholders (including management).
- Enable engineers to quickly assess the feasibility of the solution and to identify the next step towards its realization.
- Enable engineers to identify suitable tools and partners to realize a solution.
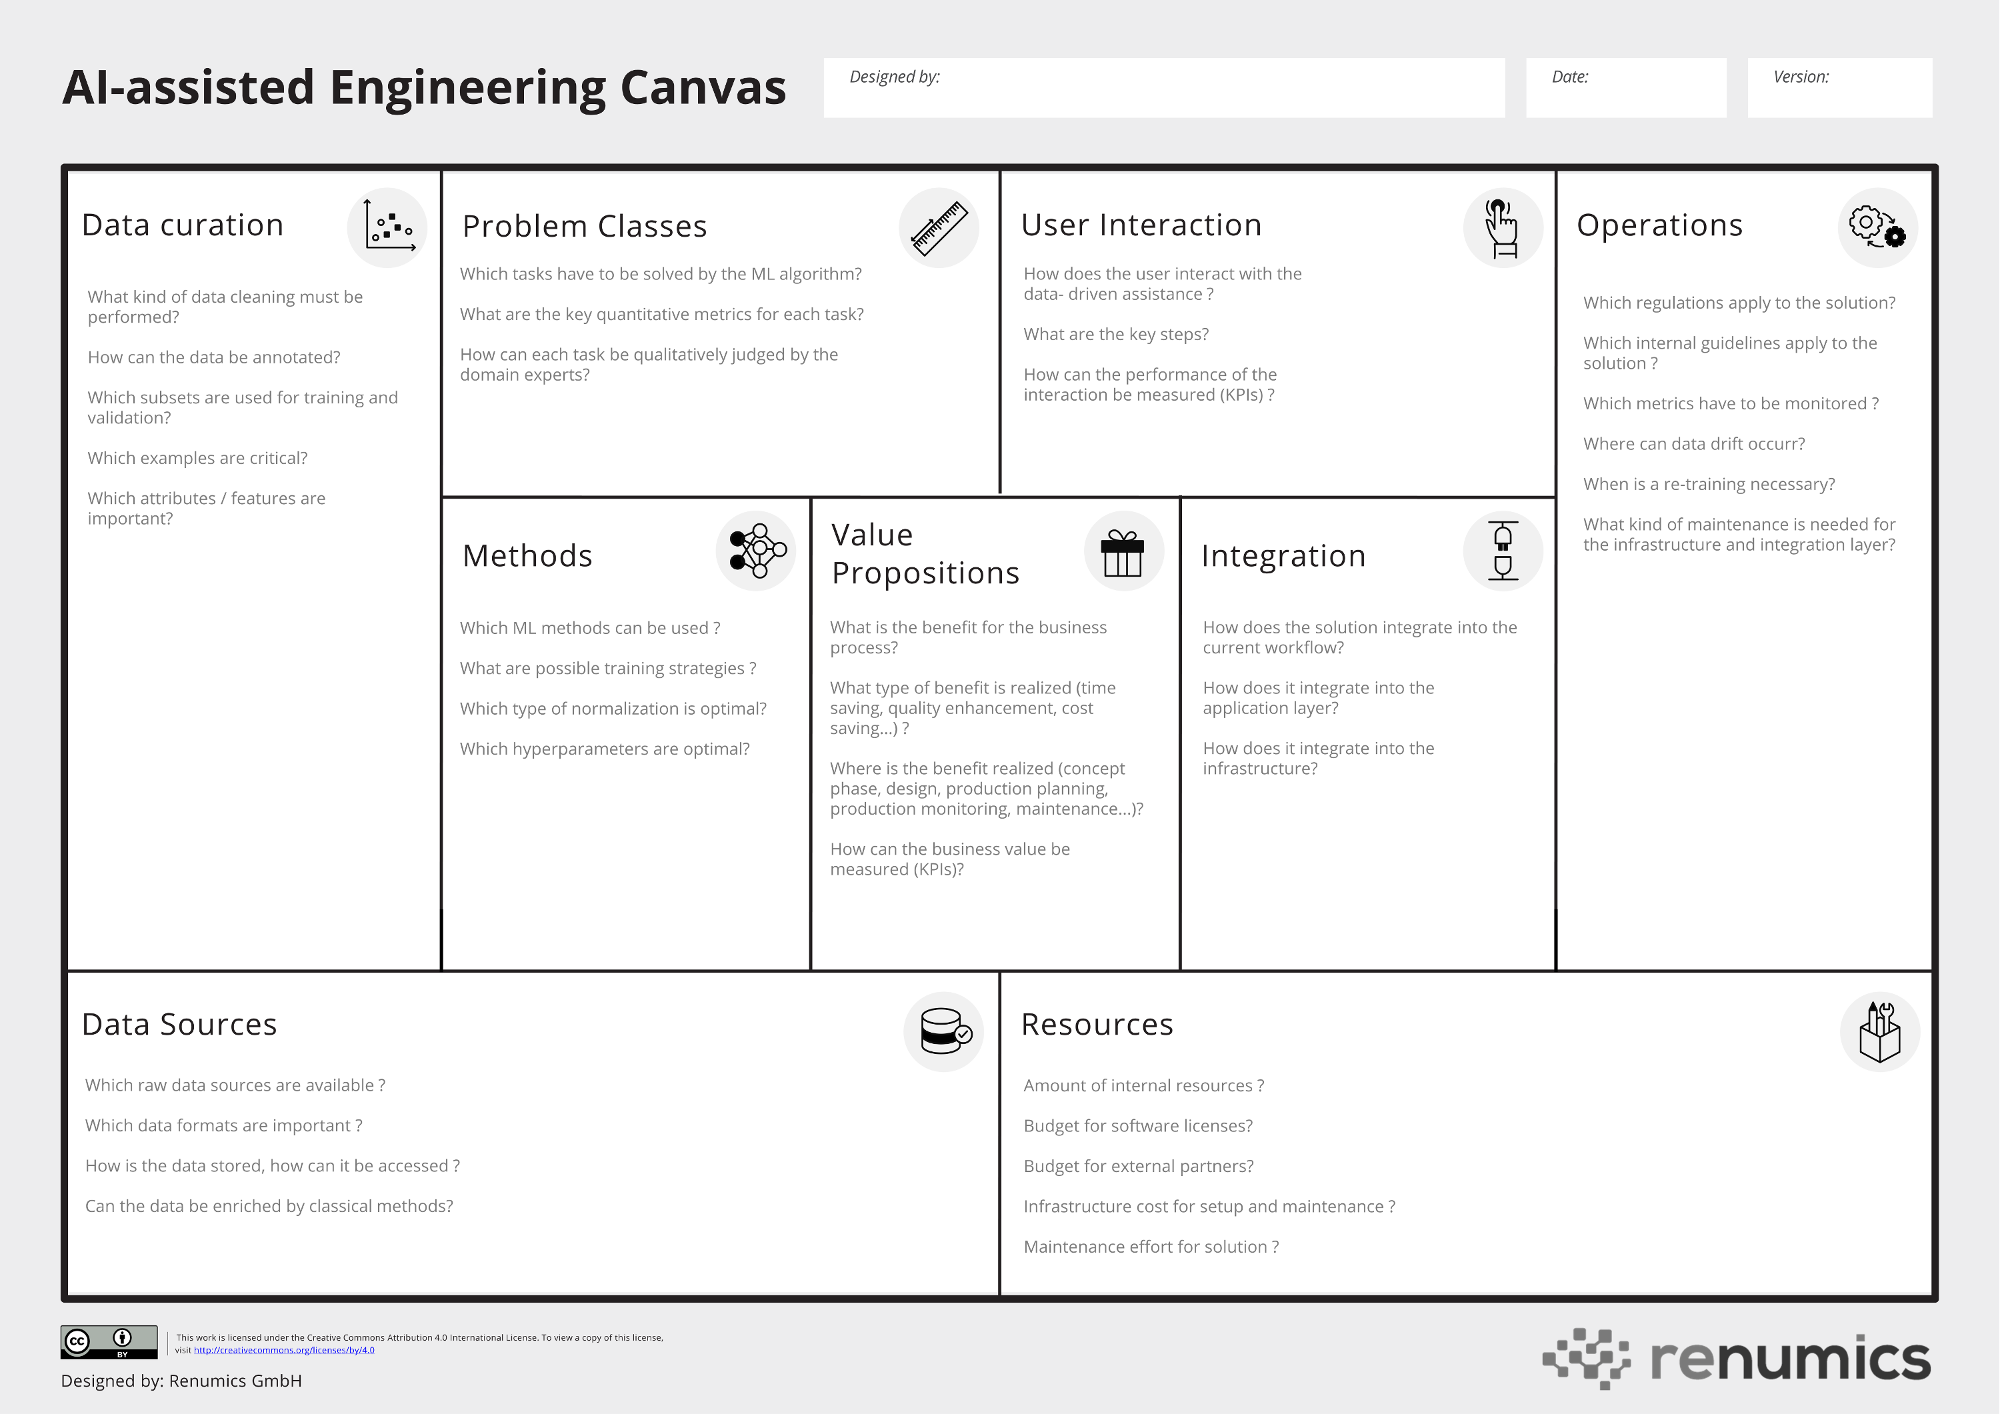
The heart of the solution: Value Proposition, User Interaction and Problem Class
The heart of the canvas is the triad between Value Proposition, User Interaction and Problem Class. Every solution should start with the definition of the business value that includes relevant KPIs (e.g. reduce analysis time by 30%). Based on this target and the specifics of the current process, a first draft for the User Interaction can be established. The draft should be as precise as possible (e.g. mockups) and should include relevant KPIs (e.g. on average, only 10 relevant data points have to be analyzed instead of all 100 test results). From the User Interaction, the concrete Problem Class for the machine learning algorithm and relevant metrics can be identified (e.g. ranking problem, metric is precision@10).
It is worth noting that the process of defining this important triad is already highly iterative to the point that even these central aspects might change within a project. It is thus even more important to deeply think about them as early as possible.
Key insights:
Although it sounds obvious, the definition of the business value is often overlooked. It is particularly important to define both the severity of the problem to be solved as well as its frequency.
The proposed canvas places an unusual weight on mapping out the User Experience. We feel that this is a step that is both very important and often neglected. Stakeholders typically emphasize the need for fully automated solutions that is technically difficult or impossible. In contrast, if you find a User Interaction that brings significant benefit to the end user even without a robust ML-backend, your solution is most likely to be successful. The analogy to vehicle automation makes this pretty clear: It is a much better strategy to solve level 2 (partial driving automation) first and realize its value, before solving the level 5 full automation grand prize.
It should be possible to communicate the metrics (or at least its most important parts) to non-experts. For example, it makes sense to shorten a ROC-curve to a concrete form that is easy to understand: “When we allow 2 false positive a months, we can catch 50% of all errors.” It is typically very helpful to include qualitative criteria (e.g. 10 worst false negatives) in the assessment.
Start the circulation: Methods, Data Sources and Data Curation
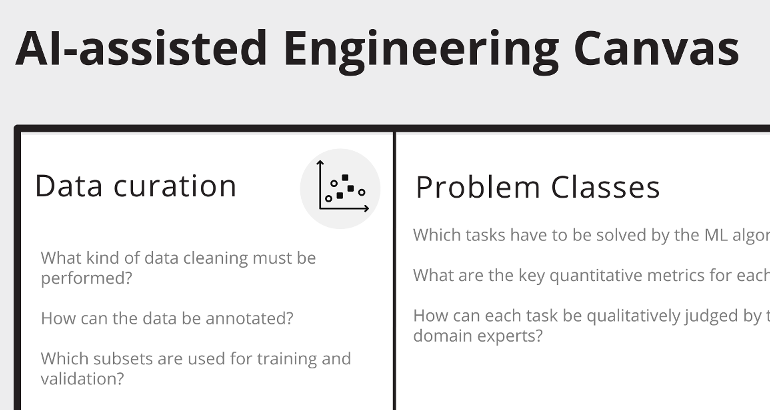
Technically, a data-driven solution starts with the available Data Sources. In first step, you simply write down which data is available, which formats are relevant and which storage or data management platforms are involved. It might also make sense to retrieve a sample dataset to underline your analysis. After that, you would like to understand if the data available is sufficient to solve your problem or if you must acquire additional data points or annotations. The questions trigger the highly iterative process of Data Curation and selecting/developing appropriate ML Methods. In this context, we use the term Data Curation to summarize all data-centric activities that influence the performance of the ML algorithm: Data cleaning, analyzing the data distribution (e.g. outliers/ relevant subsets), identifying important attributes / features as well as qualitative understanding of the model behavior. The Method part is concerned with all model-centric activities that influence the performance. Selecting appropriate ML algorithms, designing suitable training strategies and loss functions as well as hyperparameter tuning. Both activities are highly correlated and iterative.
Key insights:
To reduce the uncertainty of the project, it is desirable to get a reliable “feel” for the data and a ballpark figure of the metrics that could be achieved as quickly as possible. However, this process can take some time and requires an extremely close collaboration between domain experts and data experts.
In many engineering applications data sources can be enriched by classical methods such as geometric calculations, established transformations or simulation techniques.
Especially during the early phase of a development, a qualitative understanding of the data is almost always more important than quantitative metrics. Understand relevant edge cases, sub-populations and validate relevant patterns in the data with all stakeholders to avoid costly mistakes. It makes sense to invest in appropriate tooling either by developing your own solution or by purchasing a suitable tool. [Disclaimer: We at Renumics build data curation tools, because we feel that it is the best way to accelerate the development of AI-assisted engineering solutions].
With rare exceptions, the concrete ML model has little influence on the overall performance of the solution. Don’t waste time on hyperparameter tuning or fancy state-of-the-art modeling techniques (especially early on). However, make sure you are not doing something completely wrong (e.g. no normalization).
Get moving: Integration and Governance/Operations
For your solution to generate value, it must integrate into your current processes. In terms of Integration you have to think about both the application layer (e.g. user interface) as well as the infrastructure layer (e.g. process and data management). This means that you must involve stakeholder from the IT department. You must also think about the Governance and Operations aspects of the solution. In terms of data privacy and data protection, your solution should be compatible not only with regulatory requirements (e.g. GDPR), but also internal guidelines (e.g. need-to-know principle). You also should map out how the new solution is maintained and who is responsible for that. This applies to both the software layer (e.g. patches for application and infrastructure) as well as the data layer (e.g. monitoring of data drift, re-training).
Key insights:
You could start with a small proof of concept (PoC) and treat the Integration/Operation side as an afterthought. Our experience strongly advises against this. With relatively little effort you can identify which boundary conditions are relevant to your solutions. This can heavily influence its technical implementation.
Existing boundary conditions in terms of applications, infrastructure and governance have not been designed with data-driven methods in mind. You might be tempted to demand new rules or infrastructure to build out your beautiful new AI-based engineering solution. The better idea is to start with a solution that respects the existing boundaries, even if it is not as capable. You can move on to the bigger picture, once your solution has a proven impact on the business.
Estimate the ongoing maintenance and update costs for your solution as realistically as possible. This is an important factor both to determine if the solution is economically viable and to choose software tools and partners for the development.
Sum it up: Resources
To pitch your solution to your executive team, you basically only need two things: Describe its business value and the required Resources to build and maintain it. So, in a final step once you mapped out all other facets of your solution, you should estimate these resources. This should include internal manpower, budget for external partners, license fees for software, infrastructure costs as well as costs for education and process change.
Key insights:
It is probably a good idea to first estimate a budget for a PoC that validates the hypotheses on the AI-assisted engineering canvas. The focus of the PoC might depend on the use case, but it typically involves a first iteration on the data to assess data quality and feasibility.
As data-driven methods are not yet established in most organizations, there can be high fixed costs associated with introducing the first data-driven use case: IT infrastructure, needs for open APIs, data management capabilities and training courses are examples for these types of costs. Two things are important to overcome these hurdles: First, design you solution in a way that avoids these costs as much as possible (more specific guidance was given for each specific topic). Second, paint the bigger picture and show how the know-how, infrastructure and partnerships that arise from the specific solution can provide long-term value to the business.
Summary
We presented the AI-assisted Engineering Canvas. It allows engineers to map out new AI-powered tools to create better products faster. Along with the specific categories of the canvas, we presented several insights that we feel are key for a successful implementation.
Canvas-based methods are brought to life by showing examples. We will do just that in follow-up blogposts.
Get started
Download the PDF-version of the canvas immediatly
Register to download an editable Powerpoint version.
If you are using the canvas for your use cases, we love to hear from you on LinkedIn
Contact us under moc.scimuner@ofni if you have any suggestions or need help for your use case.